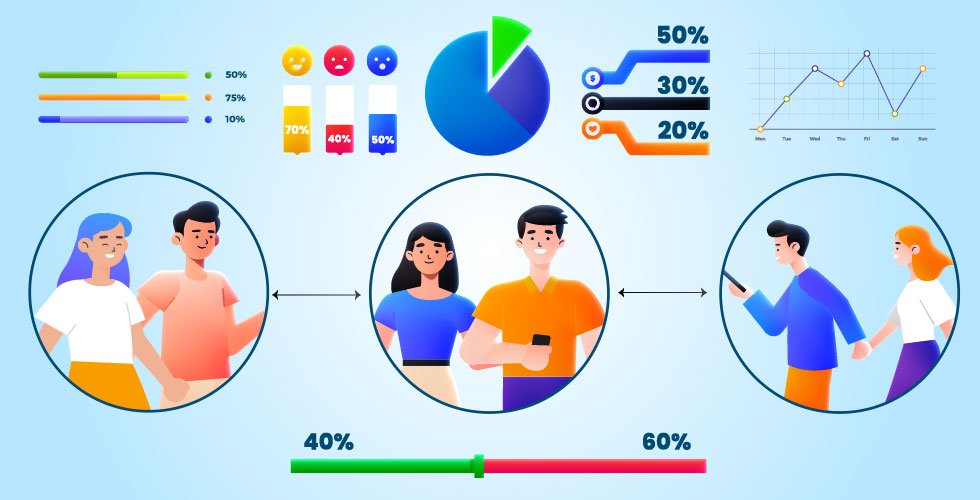
In today's digital age, where attention spans are dwindling, and visual content reigns supreme, creating interactive infographics has emerged as a powerful tool for captivating audiences and conveying complex information in a compelling manner. From data visualisation to storytelling, interactive infographics offer a dynamic and immersive experience that engages and educates users like never before. In this comprehensive guide, we'll explore the art of Creating Interactive Infographics, uncovering best practices, design tips, and actionable insights to help you harness the full potential of this versatile medium.
Creating Interactive Infographics begins with a solid understanding of your audience and their preferences. Before diving into the design process, take the time to research your target demographic, their interests, and the type of content they engage with. By gaining insights into your audience's needs and preferences, you can tailor your interactive infographics to resonate with them on a deeper level. Whether it's addressing common pain points, answering frequently asked questions, or presenting data in a visually appealing format, knowing your audience is key to creating impactful and engaging interactive content.
When it comes to designing Interactive Infographics, simplicity is key. While it's tempting to cram as much information as possible into a single graphic, overcrowding your design can overwhelm users and detract from the overall user experience. Instead, focus on presenting information in a clear and concise manner, using visuals, icons, and animations to enhance comprehension and retention. Break down complex concepts into bite-sized chunks, and guide users through the information using intuitive navigation and interactive elements. By keeping your design clean, organised, and user-friendly, you can ensure that your interactive infographics deliver maximum impact and engagement.
Furthermore, incorporating storytelling elements into your interactive infographics can elevate them from mere data visualisations to immersive experiences that resonate with users on an emotional level. Rather than presenting raw data in isolation, frame it within a narrative context that captures the imagination and draws users in. Whether it's unfolding a chronological timeline, exploring cause-and-effect relationships, or highlighting real-life examples and case studies, storytelling can bring your data to life and make it more relatable and memorable for your audience.
In addition to storytelling, interactivity is a hallmark feature of Creating Interactive Infographics that sets them apart from static graphics. By incorporating interactive elements such as clickable buttons, hover effects, and scroll-triggered animations, you can empower users to explore your content at their own pace and engage with it on a deeper level. Encourage interaction by inviting users to interact with data points, reveal hidden insights, or uncover additional layers of information. By fostering an interactive experience, you can captivate users' attention and encourage them to spend more time engaging with your content.
Moreover, optimising your Interactive Infographics for search engines is essential for maximising their reach and visibility. While search engines can't crawl the content within interactive elements such as animations or interactive charts, they can index the text-based content surrounding them, including titles, descriptions, and captions. Therefore, it's crucial to provide descriptive metadata and alt text for all interactive elements to help search engines understand the context and relevance of your content. Additionally, consider embedding text-based summaries or transcripts alongside your interactive infographics to provide search engines with additional context and improve accessibility for users with disabilities.
When Creating Interactive Infographics, it's important to prioritise mobile responsiveness to ensure a seamless user experience across all devices. With mobile devices accounting for an increasing share of web traffic, it's essential to design your interactive infographics with mobile users in mind. Opt for a responsive design approach that adapts to different screen sizes and orientations, and test your infographics on various devices and browsers to ensure compatibility and functionality. By catering to mobile users, you can reach a broader audience and deliver a consistent and engaging experience across all platforms.
In conclusion, Creating Interactive Infographics offers a powerful means of engaging audiences, conveying information, and driving user interaction. By understanding your audience, simplifying complex concepts, incorporating storytelling elements, and fostering interactivity, you can create immersive experiences that captivate and educate users like never before. Moreover, by optimising your infographics for search engines and prioritising mobile responsiveness, you can maximise their reach and accessibility, ensuring that they resonate with audiences across all channels and devices. Embrace the art of Creating Interactive Infographics, and unlock the full potential of this versatile medium to inspire, inform, and engage your audience.

No comments:
Post a Comment